

It should come as no surprise to most readers that the U.S. Government has been on a multidecade debt binge. The fact that Congress has had to provide massive stimulus programs during the Financial Crisis of 2008, as well as the Covid-19 pandemic, may obscure the fact that the road to deficit spending began decades ago. Two assumptions, incorrect in my opinion, about taxes and spending, have resulted in policies and electoral results that continue to bring us closer to a day of financial reckoning.
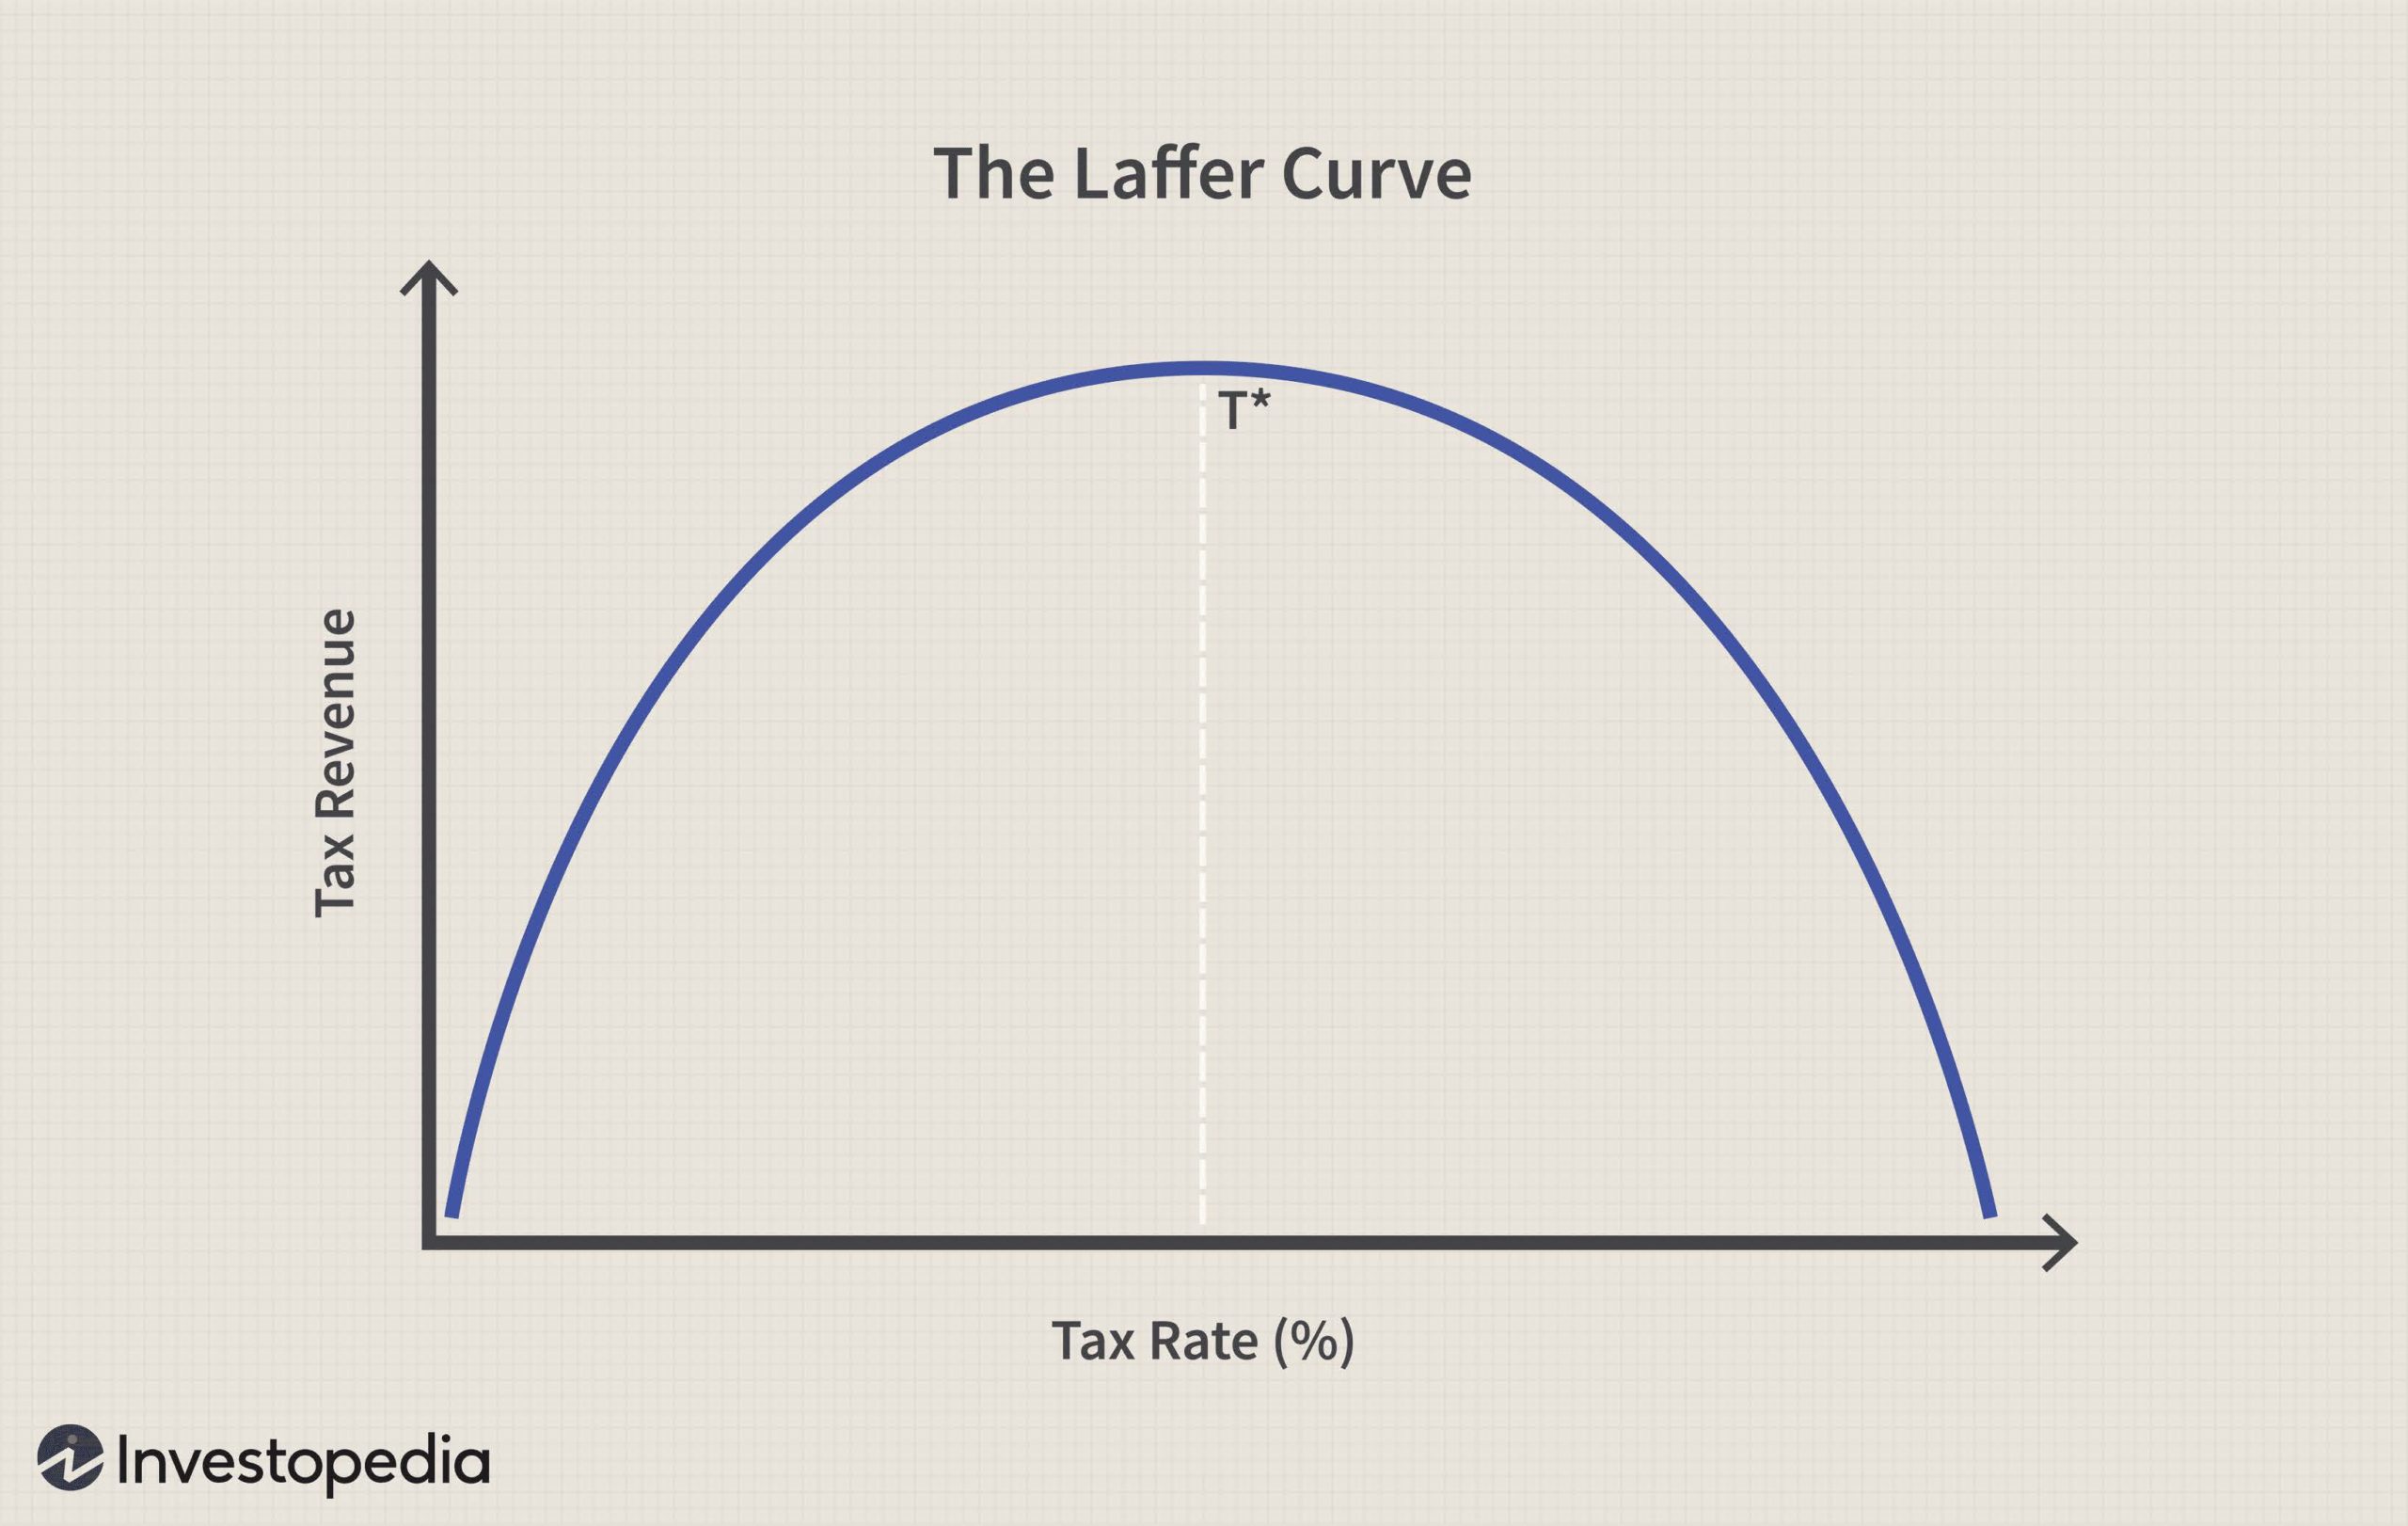
The first assumption is that tax cuts pay for themselves. This idea was created on a napkin by economist Arthur Laffer in 1974, and pitched to the staff of President Gerald Ford who was contemplating a tax increase at the time. Laffer demonstrated that there is an ideal tax rate (“T* at the top of the curve) that would maximize tax revenue, as well as incentivize workers and businesses. Unfortunately the “T*” was more of a theoretical construct than a practical guide.
It typically led to larger deficits. Despite our track record of expanding deficits, the idea that tax cuts pay for themselves remains popular.
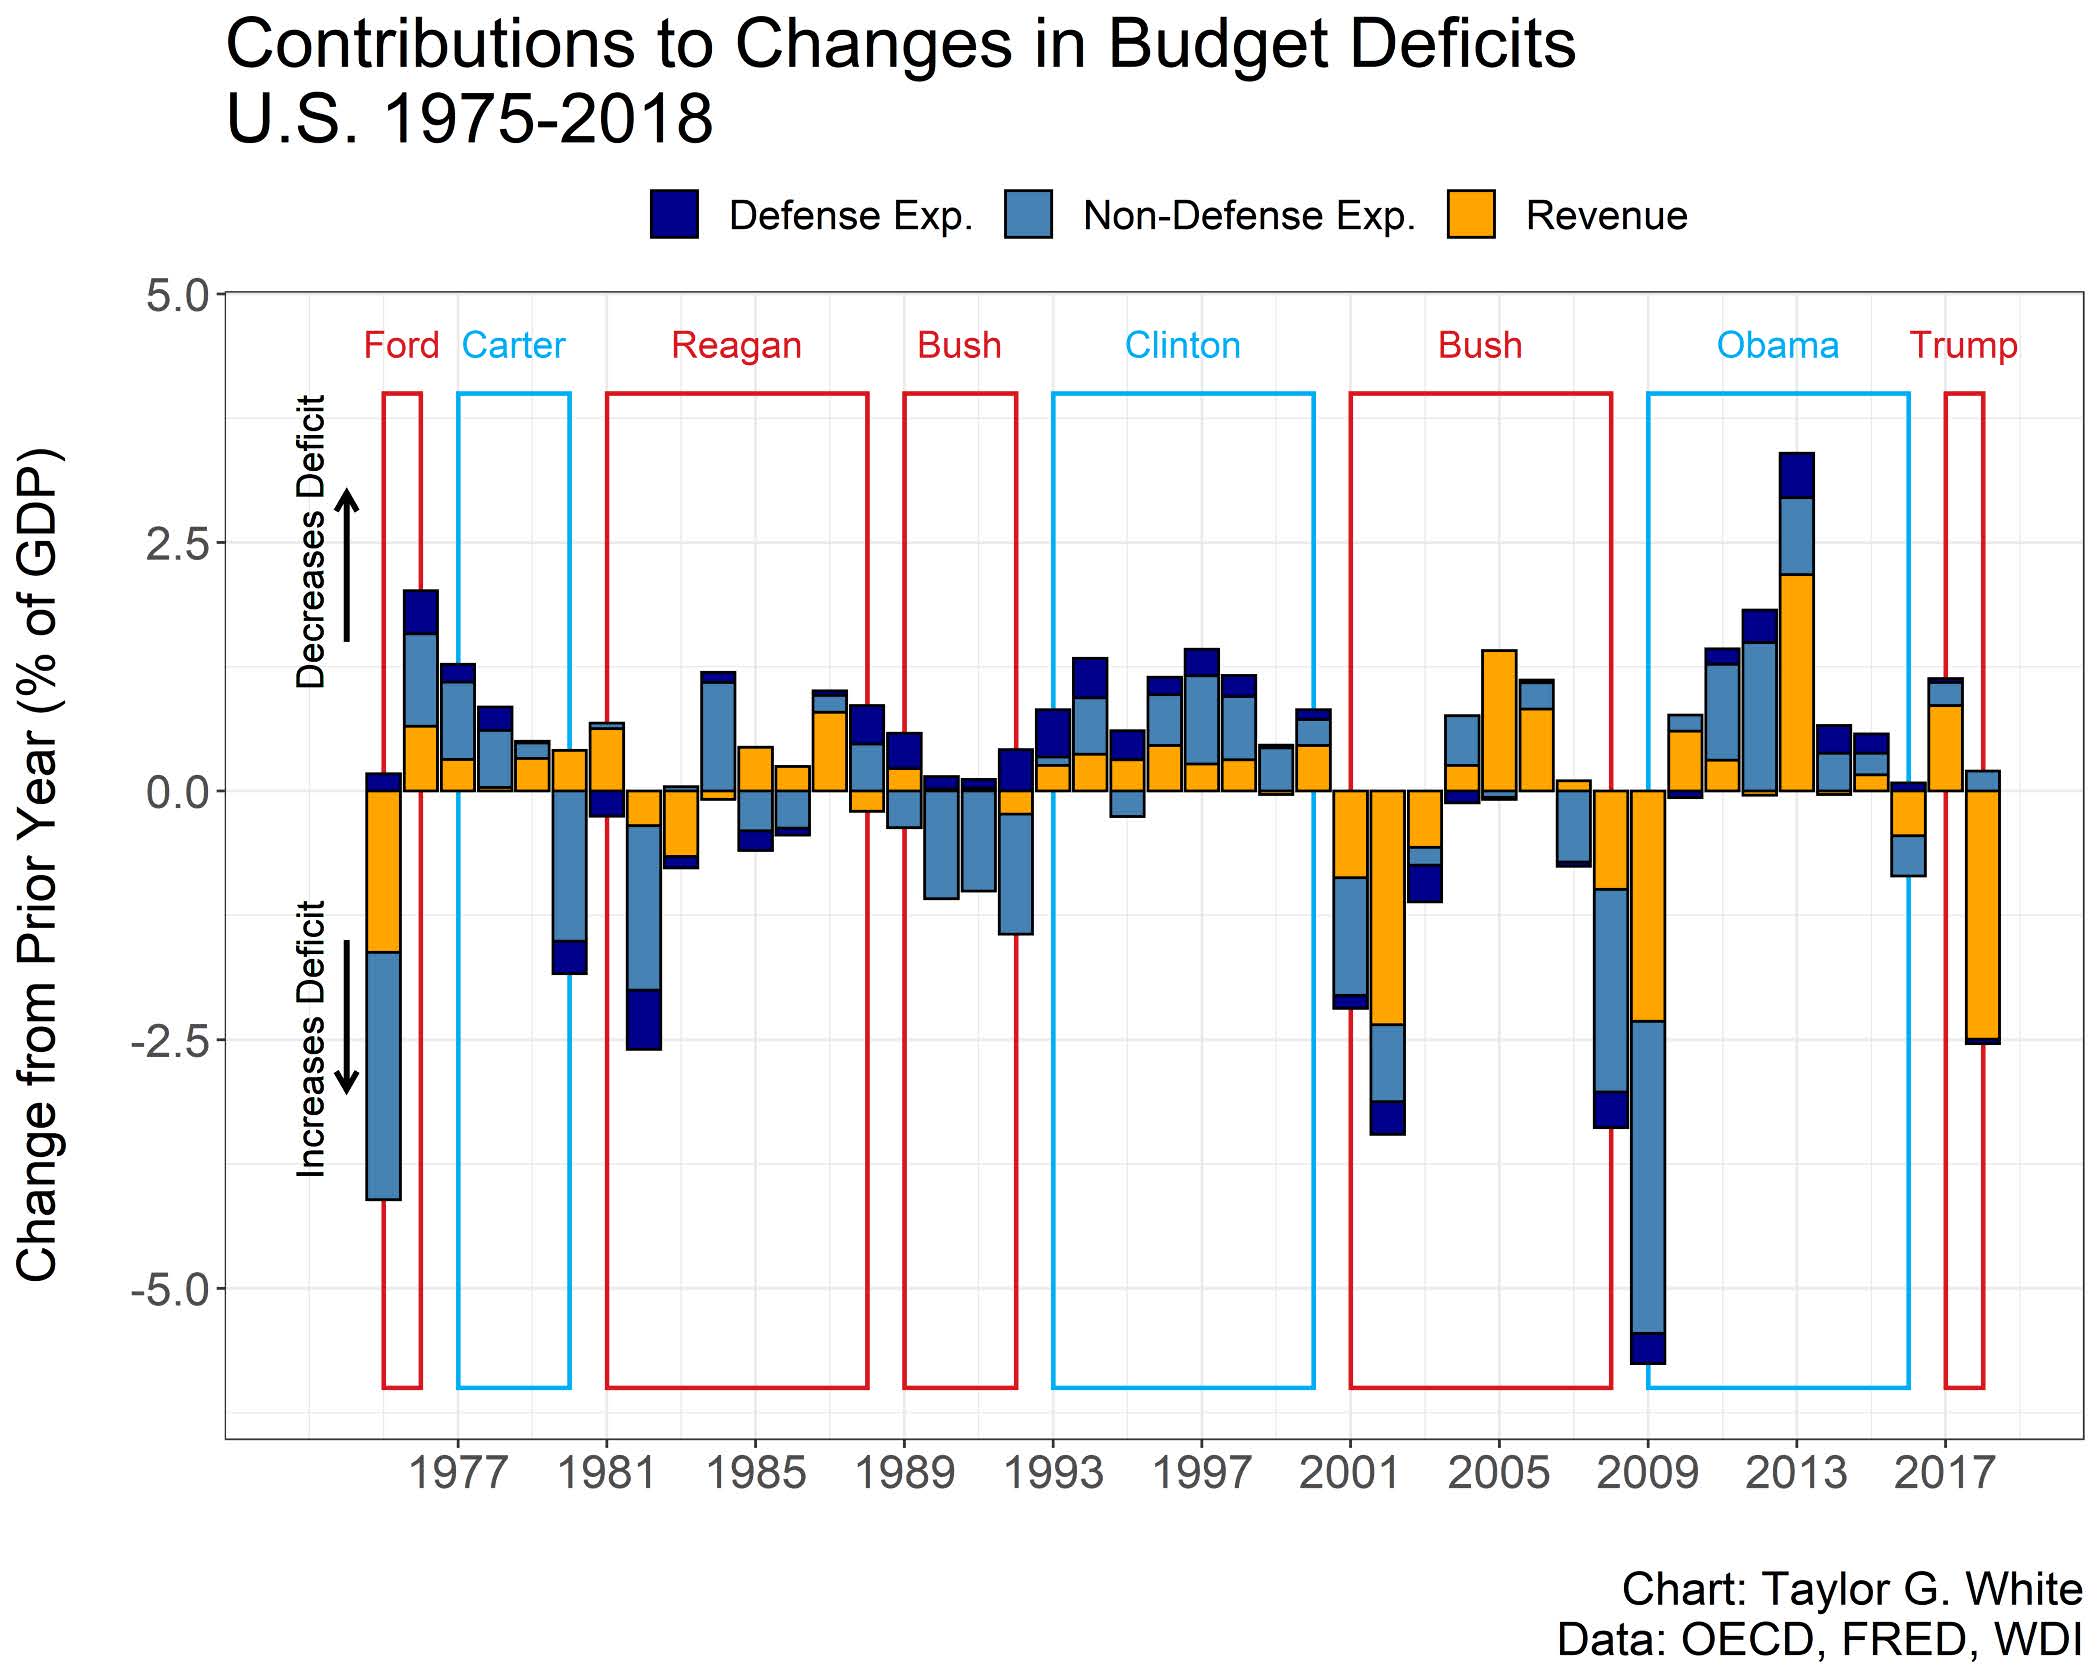
Our next chart illustrates the changes in the budget deficit for Democratic as well as Republican Administrations. Years ago, and many people still believe this to be the case, Democrats were tagged as big spenders, and Republicans were the more financially conservative party. As you will note on the chart, that characterization is not born out by the facts. Deficits have ballooned during Republican Administrations (see the descending yellow bars) as they continued to advance policies based on the premise that tax cuts pay for themselves. Deficits, believe it or not (ascending bars), have decreased during Democratic Administrations.
Taylor White of towardsdatascience.com notes, “the George W. Bush administration experienced two recessions, one slight at the beginning of the term and the great recession starting late 2007 and through early 2009. Notice that the reduction of revenues in 2002 is just as significant as in 2009. This isn’t primarily the result of people making less money and paying less taxes — this is a significant tax cut that reduced revenues. Similarly, the effects of the Trump tax cuts are visible in 2018, as revenues decreased even more than during the great recession of 2008–2009.”
However things play out in the national elections in a few months, it is not a forgone conclusion that the U.S. will be able to kick its addition to debt anytime soon. As the old saying goes, why pay for something that you can get for free otherwise.
Deprecated: preg_replace(): Passing null to parameter #3 ($subject) of type array|string is deprecated in /home/ogorek_dev_minerva/ogorek.minervawddev.com/wp-includes/kses.php on line 1805
Similar Posts


Deprecated: preg_replace(): Passing null to parameter #3 ($subject) of type array|string is deprecated in /home/ogorek_dev_minerva/ogorek.minervawddev.com/wp-includes/kses.php on line 1805
PLEASE SEE IMPORTANT DISCLOSURE INFORMATION HERE.