
The pattern of stock market returns have largely followed history under Trump’s presidency so far, with the best year in the third year of his term (2019 – S&P 500 up 31%), the worst year in year two (2018 – down 5%) and year one somewhere in the middle (2017 – up 22%). So what does history say about the fourth year of a presidential term (which would be this year)?
According to the chart below, the fourth year tends to be quite good, with median returns for the S&P 500 of around 10%. However, there is also a larger than normal disparity in returns, or in other words, returns tend to be more volatile. This could have to do with the fact that the elections are held in year four, which brings uncertainty and could mean a change in policies, good or bad.
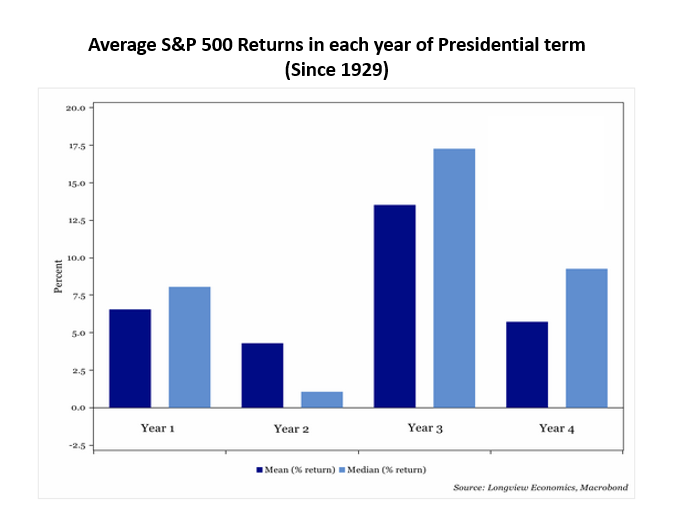
Source: Longview Economics, Macrobond (via the daily shot on the Wall Street Journal)
Deprecated: preg_replace(): Passing null to parameter #3 ($subject) of type array|string is deprecated in /home/ogorek_dev_minerva/ogorek.minervawddev.com/wp-includes/kses.php on line 1805
Similar Posts


Deprecated: preg_replace(): Passing null to parameter #3 ($subject) of type array|string is deprecated in /home/ogorek_dev_minerva/ogorek.minervawddev.com/wp-includes/kses.php on line 1805
PLEASE SEE IMPORTANT DISCLOSURE INFORMATION HERE.