
If you count 2018’s fourth-quarter drop in stocks as a bear market (stocks fell 19.5% instead of the 20% required for a technical “bear market”), 2019’s recovery (blue line on the chart below) is right in line with the average historical recovery following bear markets (red line). What’s more, the chart suggests the stock market has considerable more upside to go this year.
We keep hearing how this is the longest bull market in history (at 10 years), which conditions investors to brace for the end. Perhaps it’s better to think of the current bull market as just 1 year old instead.
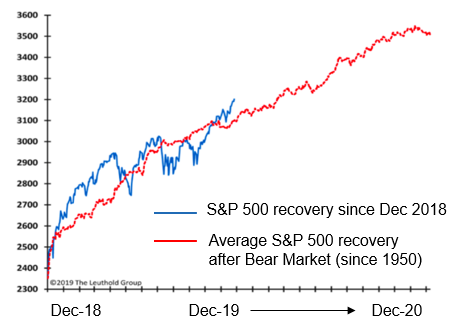
Chart Source: Leuthold Group (via Yahoo Finance)
Deprecated: preg_replace(): Passing null to parameter #3 ($subject) of type array|string is deprecated in /home/ogorek_dev_minerva/ogorek.minervawddev.com/wp-includes/kses.php on line 1805
Similar Posts


Deprecated: preg_replace(): Passing null to parameter #3 ($subject) of type array|string is deprecated in /home/ogorek_dev_minerva/ogorek.minervawddev.com/wp-includes/kses.php on line 1805
PLEASE SEE IMPORTANT DISCLOSURE INFORMATION HERE.